d3 Geospatial
d3.js + maps = geospatial bliss!
last updated April 2, 2015 12:15 PM
As a simple web search will tell you, D3 is a data visualization library that runs like lightning in your web browser. You may hear data visualization and think I don't need a data viz lib, I make maps. Well, maps run on data, plus D3 is actually pretty good with maps, so keep an open mind. You might also wonder why you would choose D3 over another library like Leaflet.js. The short answer is it really depends on your use case and the type of data you want to display. The long answer is this tutorial.
D3 stands for Data Driven Documents. We will unpack this title in three parts. First, we'll take a look at Documents, then check out Data and finally explore Driven. By the time we dive into the meat and potatoes of the tutorial, you should have a pretty clear sense of how D3 relates to technology you've used in the past.
Housekeeping
To successfully follow this tutorial you need a text editor (such as Notepad++ or Sublime Text). Go ahead and use your personal favorite, or if you don't have one installed, download Sublime Text.
Documents
At its core, D3 takes your information and transforms it into a visual output. That output is your document, and in the case of this tutorial, your document is an SVG. Scalable Vector Graphics is a file format that encodes vector data for use in a wide array of applications, including your web browser. SVGs are used all over the place to display all kinds of data. If you've ever exported a map from desktop GIS and styled it in a graphics program, chances are your data was stored as SVG at some stage of the process.
SVGs are human readable, which works well for us because we aren't computers. This is an SVG:
1<svg width="720" height="120">
2  <circle cx="40" cy="60" r="10"></circle>
3  <circle cx="80" cy="60" r="10"></circle>
4  <circle cx="120" cy="60" r="10"></circle>
5</svg>
This circle example is the same document embedded in a really simple web page. Right click one of the circles and select Inspect element from the drop down.
Each of those circles is an element in your SVG, which has a width and height. This is the type of document D3 writes to your web browser. You can tell it to add circles or move circles or remove circles. Checkout this selection tutorial for more on the subject. It's also worth noting that D3 has the ability to write and edit many types of shapes, not just circles.
Data
So, you have a tool that can write a Scalable Vector Graphic in your web browser... That doesn't really do anything for you unless you have something you want to draw. In D3, that something is almost always based on data.
Let's take a look at this scatterplot. This type of visualization is familiar to most and easy to understand. Sepia Width is plotted on the x-axis and Sepia Length is plotted on the y-axis. D3 draws the entire graphic. But how does it know what to draw and where to draw it? Scroll down the page until you see data.tsv (or just click that link). When this web page loads, D3 reads this file and adds each record as a circle in the scatter plot. Each circle's coordinates and color are defined by the data in the record.
Driven
At this point Driven might not make sense. If we stopped here, we could probably make a case to change Driven to Defined. Let's keep going.
Driven is actually one of the defining characteristics of D3. Take a theoretical work-flow where you export an SVG from desktop GIS to do custom design work in a graphics editor. As soon as your vector data leaves the GIS, features lose the data that defines them. At best, the great attributes you honed are represented graphically and at worst are totally gone.
That type of thing doesn't happen in D3. Not only does your data define the elements in your SVG, the data is also bound (joined) to the elements in your document. A circle isn't just a circle element with an x,y and radius, it's also the data that originated the element in the first place. This characteristic of D3 allows data to drive your visualization, not only upon creation, but throughout its life cycle.
Tips
- The learning curve can be pretty steep. Stay positive
- Start simple, add complexity piece by piece
- Refer to documentation/tutorials
- Cannibalize code wherever/whenever you can. D3 has great examples and most the code is freely accessible. See something you like? Take a look at how it's done
Tutorial Time!
By the time we finish this tutorial, we will have built our first (or nth) D3 web map! This will not be the prettiest map you've ever made, but hopefully once you've made it, you will have a launching pad to make an even better D3 map in the future.
STEP 1: Review Web Pages
If you need a primer (or review) of wep page compenents, check out this web map tutorial. While there, go through the steps to make an empty html file (through Add a boilerplate to map.html).
At this stage, you should have a map.html file on your machine that you can open in your web browser. Give that a shot by opening map.html in your web browser. This is what your file looks like:
1<!doctype html>
2<html lang="en">
3
4<head>
5  <meta charset="utf-8">
6  <style>
7    body {
8      background-color: green;
9    }
10  </style>
11
12</head>
13
14<body>
15  <script>
16    var bestPlaceEver = "maptime";
17  </script>
18</body>
19</html>
Save your eyes. Feel free to change the background color to white:
1  body {
2    background-color: white;
3  }
Include the some javascript libraries
In order for our code to do awesome things, we want to use some existing tools (d3.js bing one of them...)
Now you can insert D3 into your page. For now we'll use an externally hosted version of the library instead of copying it into a new file. We will also add the library to work with topojson. More on that later. Add the following directly after the <head> tag of map.html.
1  <script src="http://d3js.org/d3.v3.min.js"></script>
2  <script src="http://d3js.org/topojson.v0.min.js"></script>
STEP 2: Build the document
Before we add a map to our web page, we need to make a place to put it. The following work will take place between <script> tags.
Define width and height of your graphic
1  var width = 960,
2      height = 480;
Create your SVG
1  var svg = d3.select("body").append("svg")
2        .attr("width", width)
3        .attr("height", height);
This chunk of code tells your browser that the variable svg is an SVG element under the body tag. If the SVG doesn't exist, D3 creates one. Add this to map.html and reload the page. Right click in the upper left region of the page. Select Inspect Element, and you'll see that your page contains an empty SVG element.
Define your projection
1  var projection = d3.geo.equirectangular()
2        .scale(153) // scales your map
3        .translate([width / 2, height / 2]); // centers in SVG
When you define a projection, you tell D3 how to transform your data from spherical to Cartesian coordinates. Take a look at the projection docs to get a sense of how you can project your data with D3.
Translate to screen coordinates
1  var path = d3.geo.path()
2        .projection(projection);
When D3 renders your SVG, it has to translate geo coordinates to pixel coordinates on your screen. This functionality is called a path generator. In this block, we store our path generator in the variable path so we can access it through out our code.
At this point, all you have is an empty SVG on your page. Now that our document is ready, we need data.
STEP 3: Grab map data
The data we'll use for this map is stored in the TopoJSON format. We won't address specifics here, but if you want to learn more about the spatial format TopoJSON, take a look at the wiki.
Your data is waiting for you here. (click "Download Gist")
Download the data and unpack it! If you don't have software to unzip the data, you can also copy the raw contents to a file on your computer and save as worldtopo.js. Move worldtopo.js to the same location as map.html.
STEP 4: Load the data
If you look at the beginning of the worldtopo.js file, you will see
1var worldtopo = {...}
we went ahead and defined the data as a javascript variable, so you wouldn't need a webserver to make this tutorial work. To use this data, we need to load it as a script. Just below the two other libraries, we'll add one more that references this file. That section should now look like this:
1  <script src="http://d3js.org/d3.v3.min.js"></script>
2  <script src="http://d3js.org/topojson.v0.min.js"></script>
3  <script src="worldtopo.js"></script>
When you complete this next step, you will have a map. Below your path generator, insert the following:
1  svg.append("path")
2      .datum(topojson.object(worldtopo, worldtopo.objects.land))
3      .attr("class", "land")
4      .attr("d", path);
5  svg.append("path")
6      .datum(topojson.mesh(worldtopo, worldtopo.objects.countries, function(a, b) { return a.id !== b.id; }))
7      .attr("class", "boundary")
8      .attr("d", path);
This chunk of code goes through worldtopo.js and appends two features (land and boundaries) to the path generator. This is a great time to Inspect Element on your web page or dig into the TopoJSON. As you can see, your SVG has a "path" element (shape) for each feature in your TopoJSON. See how data drives this document?
Now your map should look like this:
STEP 5: Make it pretty
add some basic styles
add these lines to the <style></style> section of the page to give a nice blue background and a border to the svg element, and to color the land and boundary elements
1  svg {
2    border: 2px solid black;
3    background-color: #a4bac7;
4  }
5  .land {
6    fill: #d7c7ad;
7    stroke: #766951;
8  }
9
10  .boundary {
11    fill: none;
12    stroke: #a5967e;
13  }
Looking better:
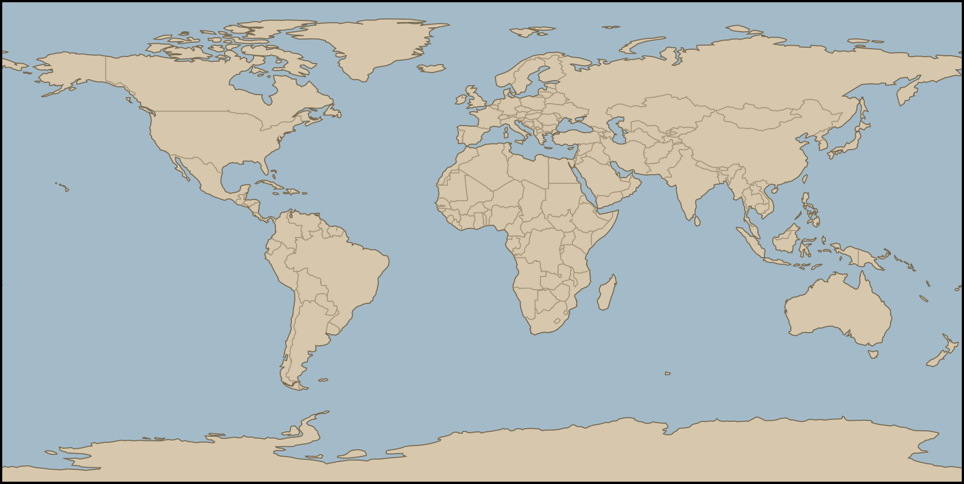
Add the graticule
We don't need a graticule, but it is a nice thing that is available in d3, so let's use it!
insert this graticle code at the bottom of your current <script></script> section
1  var graticule = d3.geo.graticule();
2
3  svg.append("g")
4    .selectAll("path")
5    .data(graticule.lines)
6    .enter().append("path")
7    .attr("d", path)
8    .attr("class", "graticule");
and add these styles to the <style></style> section
1  .graticule {
2    fill: none;
3    stroke: #fff;
4    stroke-width: .5px;
5  }
6
7  .graticule :nth-child(2n) {
8    stroke-dasharray: 2,2;
9  }
Hey - that looks like a real map!

Congratulations! You built a web map in D3.js!
STEP 6: Challenges
- Change the translation. Try .translate([400,600])
- Change the scale. Try .scale(500)
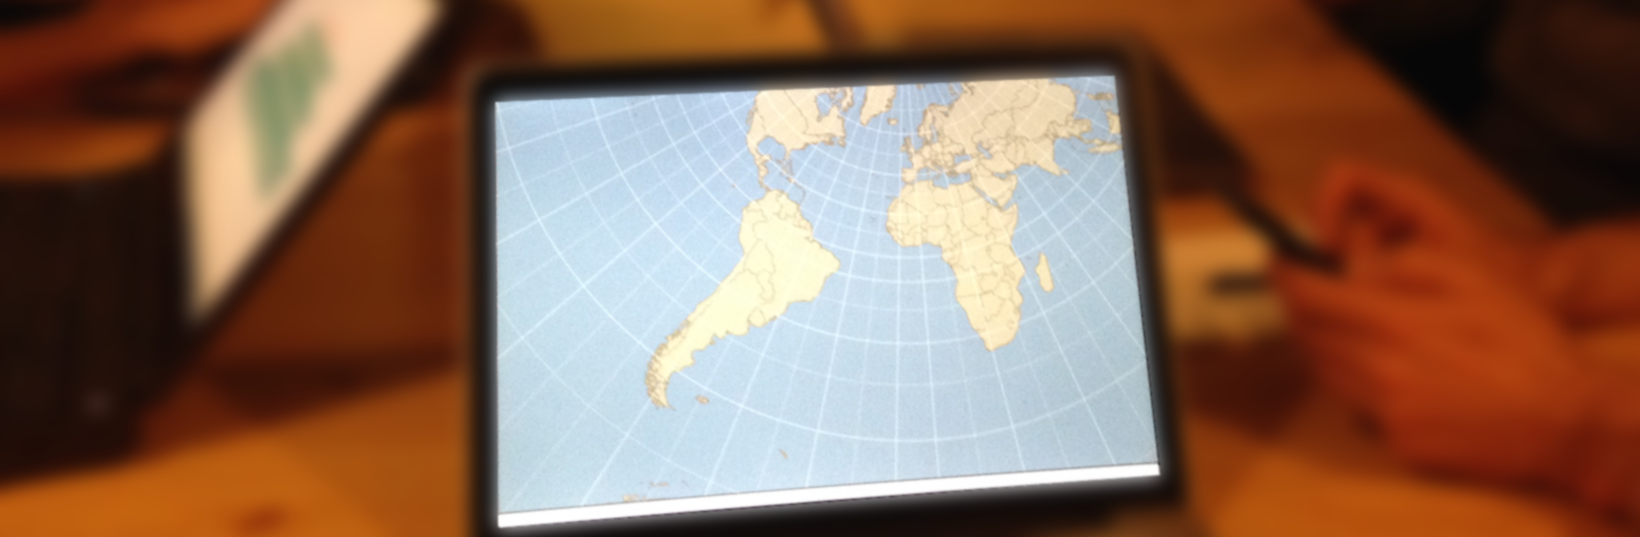
- Change the projection. Try something else. (this is a nice globe d3.geo.orthographic()!)
- Find the data. Use your JS console to access a element data. Hint: it involves a selection
- Load data from file Try this TopoJSON - instead of defining it with
var worldjson =, load it using d3.json. Examples outlined here - Try rotating the projection Here's a way to continuously update the rotation:
1  var lat = 0;
2  setInterval(function(){
3    lat = lat +.25
4    projection.rotate([lat,0]);
5    svg.selectAll(".land")
6      .attr("d", path);
7    svg.selectAll(".boundary")
8      .attr("d", path);
9    svg.selectAll(".graticule")
10      .attr("d", path);
11  },50);
Resources
Fin.
Tutorial borrows HEAVILY from MaptimeSea and maori.geek. Check out their other stuff!