abenrob
about
My name is Adam Roberts
I’m a data visualizer and developer in Grenoble, France
Stuff I like to play around with...
Spatial SQL and sqlite
Exploring spatialite in the browser
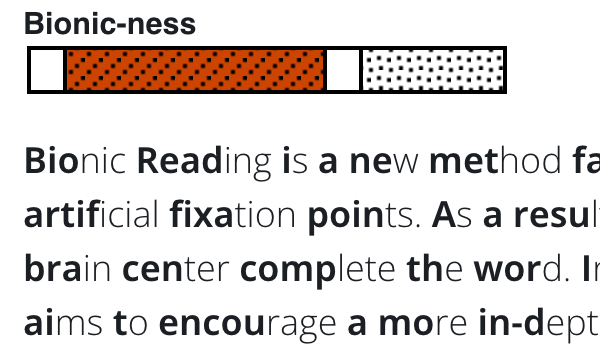
Bionic Text Explorations
Would word-split font styling do the trick as well?
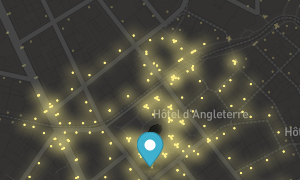
Isochrone display in MapboxGL
Overcoming overlapping polygons
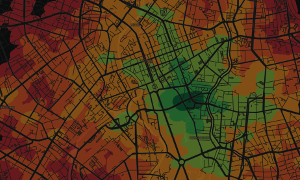
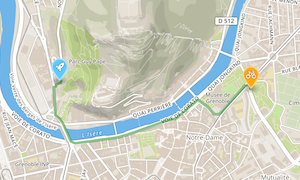
Route finding for bikes
Using routing APIs in Isère, France
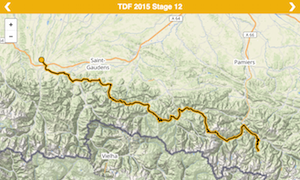
Tour de France 2015
Visualize the stages of the TdF
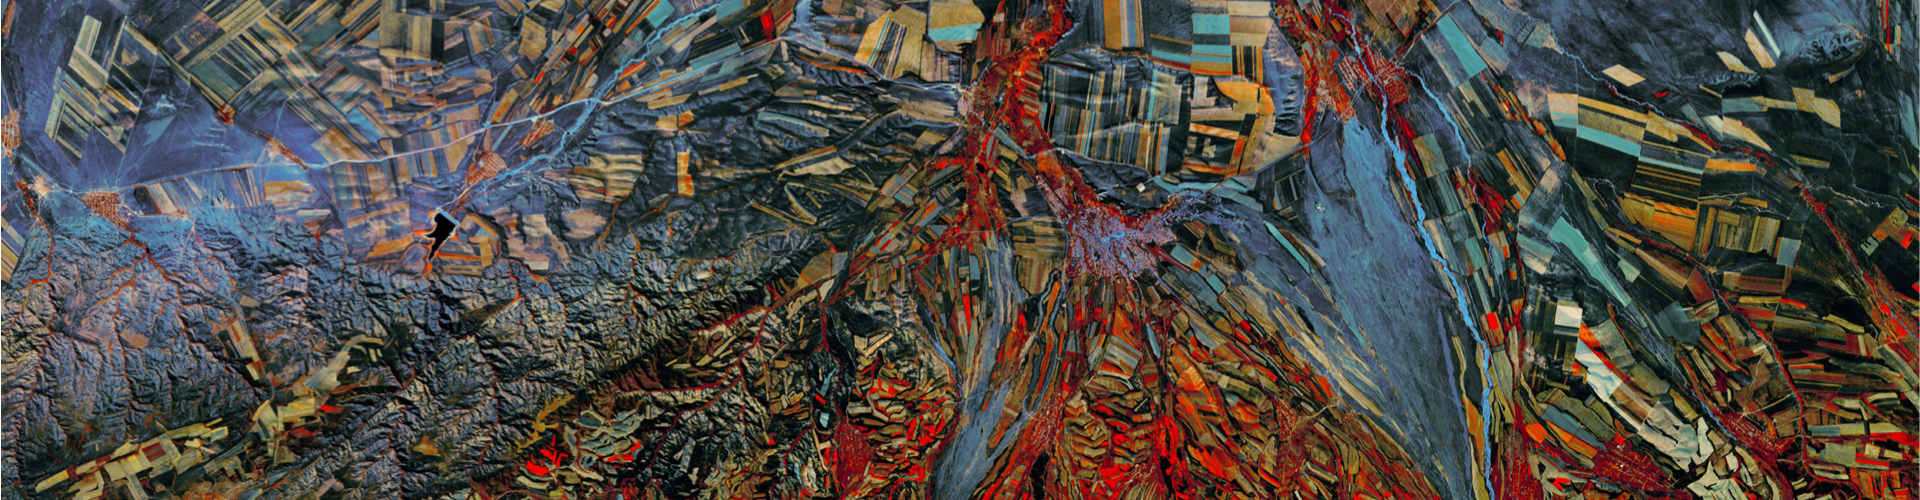
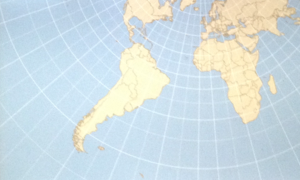
d3 Geospatial
d3.js + maps = geospatial bliss!
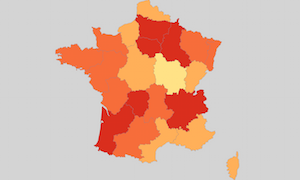
Flu Epidemic 2014-2015
Exploring the spread of the flu in France
Maptimify yr life
More Maptime! More Stacked Rainbows!
BigOut
All the magic of BIG, now in PDF!
© 2024 abenrob
Contact
LinkedIn
Instagram
GitHub