Isochrone display in MapboxGL
Overcoming overlapping polygons
last updated July 6, 2017 12:00 AM
Isochrone maps are wonderful ways to communicate accessibility area. Targomo creates wonderful isochrones. These isochrones are polygons, growing larger in size with the time of travel. As each polygon represents a reachable area, they are, by nature, overlapping. In leaflet (and google maps) the polygons can be displayed as SVG, which offers some benefits for displaying these overlapping polygons.
In MapbogGL, polygons are currently based on GeoJSON, and the rendering is done by webGL. Although webGL has some ways to deal with polygon overlap priority, MapboxGL does not (yet) expose these functionalities. So what do we do?
With SVG, the draw order preserves the overlapping hierarchy, while putting the polygons into a <g></g> group element allows the opacity to be controlled for all polygons simultaneously. On top of that, SVG edge-weight is used to make the polygons appear to scale, but without redrawing - nice!
In MapboxGL, however, These polygons display as overlapping, which isn't great! There are some options though...
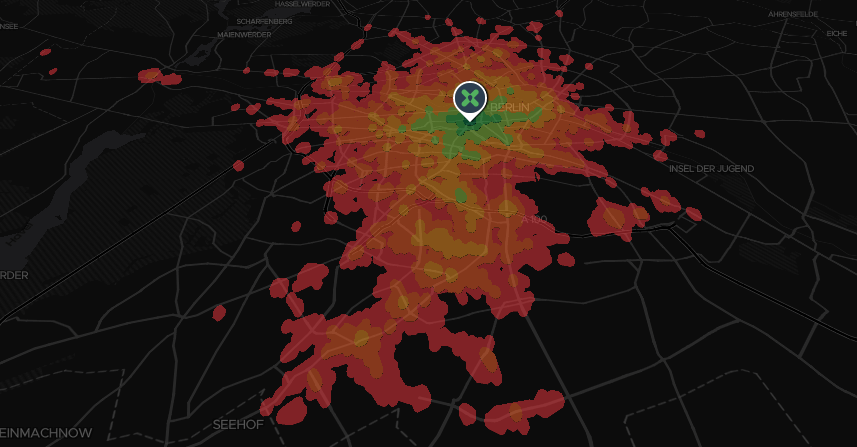
If we add extrusion to the polygons, each polygon shares the same height origin, which makes inner polygons extrude through the outer polygons.
1const travelTimes = [300, 600, 900, 1200, 1500, 1800];
2const timeColors = ['#006837', '#39B54A', '#8CC63F', '#F7931E', '#F15A24', '#C1272D'];
3 // height stops function
4function getHeightStops(travelTimes, heightFactor) {
5    return [
6        [travelTimes[0], travelTimes.length * (10 * heightFactor)],
7        [travelTimes[travelTimes.length - 1], travelTimes.length * heightFactor]
8    ]
9}
10
11// color stop function
12function getColorStops(times, colors) {
13    const colorsConfig = times.map((time, idx) => {
14        return [times[idx], colors[idx]];
15    });
16    return colorsConfig;
17}
18
19// add
20map.addLayer({
21    'id': 'polygons',
22    'type': 'fill-extrusion',
23    'source': {
24        'type': 'geojson',
25        'data': geojsonPolygons
26    },
27    'layout': {},
28    'paint': {
29        'fill-extrusion-base': 0,
30        'fill-extrusion-height': {
31            'property': 'time',
32            'stops': getHeightStops(travelTimes, 2)
33        },
34        'fill-extrusion-color': {
35            'property': 'time',
36            'stops': getColorStops(travelTimes, timeColors)
37        },
38        'fill-extrusion-opacity': .5
39    }
40});
Which gives a nice looking visualization, especially with high pitch.

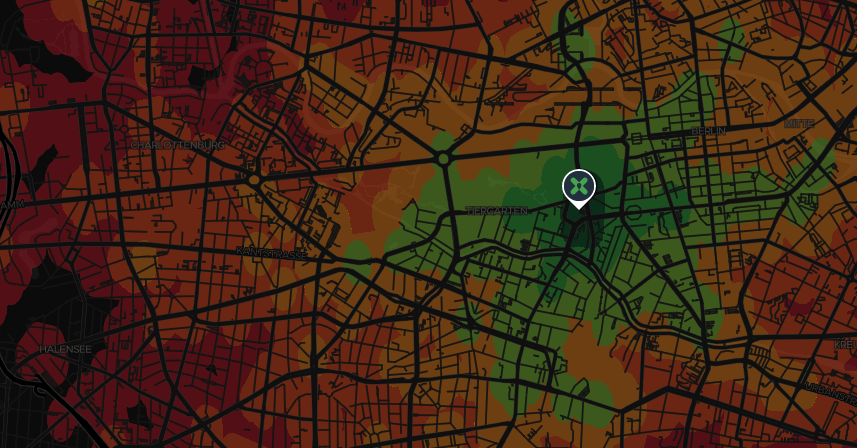
That approach can look a bit funny without map pitch, and with extrusion, you can't really put it under other layers - the roads, for example. In the second version, I use TurfJS to cut each polygon from its larger neighbor.
1const travelTimes = [300, 600, 900, 1200, 1500, 1800];
2const timeColors = ['#006837', '#39B54A', '#8CC63F', '#F7931E', '#F15A24', '#C1272D'];
3// color stop function
4function getColorStops(times, colors) {
5    var colorsConfig = times.map((time, idx) => {
6        return [times[idx], colors[idx]];
7    });
8    return colorsConfig;
9}
10
11const polySort = geojsonPolygons.features.sort((a, b) => {
12    return b.properties.time - a.properties.time;
13})
14
15let clippedPolys = [];
16
17polySort.forEach((polygon, idx) => {
18    const isLast = idx == (polySort.length - 1);
19    const previous = polySort[idx - 1];
20    if (previous) {
21        const clip = turf.difference(previous, polygon);
22        clippedPolys.push(clip);
23    } if (isLast) {
24        clippedPolys.push(polygon);
25    }
26});
27
28// put 'em back together
29var donuts = turf.featureCollection(clippedPolys);
30
31map.addLayer({
32    'id': 'polygons',
33    'type': 'fill',
34    'source': {
35        'type': 'geojson',
36        'data': donuts
37    },
38    'layout': {},
39    'paint': {
40        'fill-color': {
41            'property': 'time',
42            'stops': getColorStops(travelTimes, timeColors)
43        },
44        'fill-opacity': .5
45    }
46}, 'highway_path');
Which gives a really nice look when flat, and under the roads.
